 เครื่องมือ VRAY

Analysts think ทอง prices will stay high in late 2025. Most experts say prices will not fall fast. They believe gold will go up slowly or stay the same.
Gold went up 25% early in 2025. It hit a new high of $3,500 ต่อออนซ์.
New forecasts say gold will be between $3,100 และ $3,700 ต่อออนซ์ for the rest of the year.
Market tools and เครื่องวิเคราะห์ทองคำ data show central banks want more gold. Many investors are also interested. This keeps prices strong.
Understanding these trends is important. Using a gold analyzer helps investors feel sure about their choices in this new price market.
ประเด็นสำคัญ
Gold prices rose sharply in early 2025 and are expected to stay strong or rise slowly through the rest of the year.
Central banks and investors keep buying gold, which supports high prices and shows trust in gold as a safe asset.
Analysts mostly predict gold will stay above $3,000 ต่อออนซ์, with some expecting prices to reach $4,000 หรือมากกว่า.
Using gold analyzer tools helps investors track market trends, manage risks, and make smarter decisions.
Investors should watch for quick market changes, world events, and interest rate moves to protect their investments.
Gold Price Outlook

Rise or Fall?
Most analysts expect gold prices to remain strong in the second half of 2025. They do not see a sharp drop coming. แทน, they predict that gold will either rise slowly or hold steady above $3,000 ต่อออนซ์. Several factors support this view.
Central banks continue to buy gold. They want to protect their reserves from global risks. Investors also keep adding gold to their portfolios. Gold-backed ETFs have seen net inflows, and total holdings have grown by 329 tonnes so far this year. Chinese demand remains steady, with the central bank buying gold for 18 months in a row.
Spot gold traded near $3,298 per ounce in June 2025. Many experts expect prices to rebound toward $3,350 หรือ $3,400 as inflation cools. Lower inflation could lead central banks to cut interest rates. This would make gold more attractive because real yields would fall.
📈 Key drivers for gold’s strength include:
Central bank buying
Geopolitical tensions
Inflation fears
Investor demand through ETFs
Expectations of lower interest rates
These trends suggest that gold will likely stay in a higher price range for the rest of 2025.
Analyst Consensus
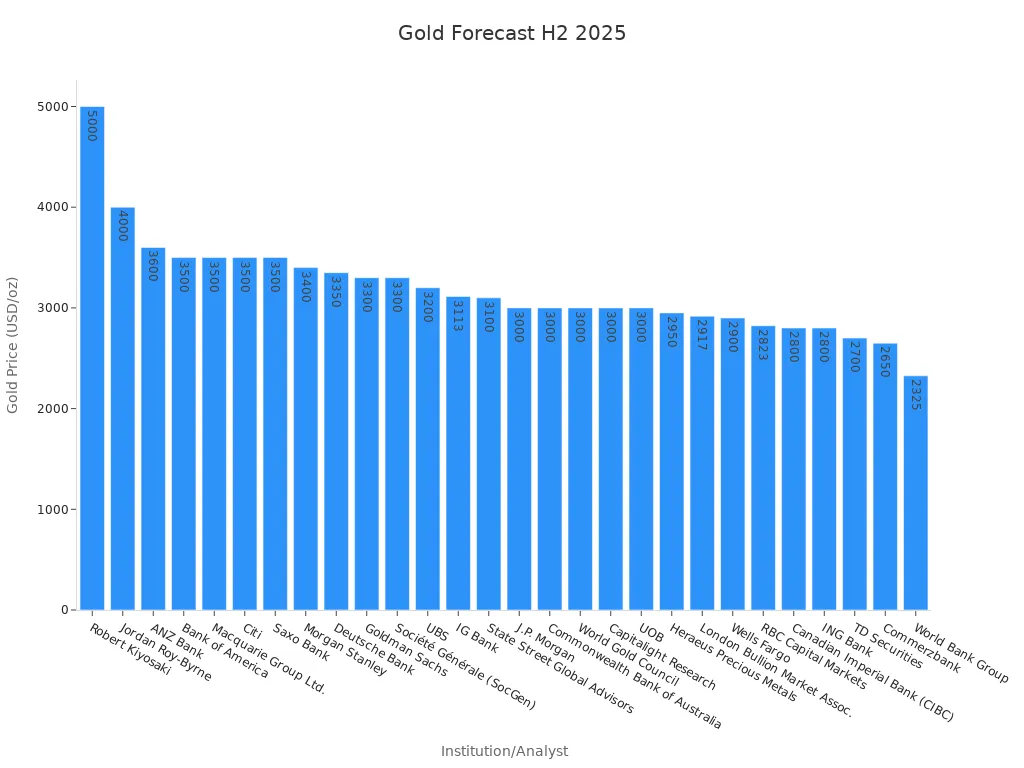
Analyst forecasts for gold prices in H2 2025 show a strong bullish consensus. Many banks and experts have released their price targets. Most expect gold to stay above $3,000 ต่อออนซ์, with some predicting even higher levels.
Institution/Analyst | Gold Price Forecast (USD/oz) | Time Frame |
|---|---|---|
Robert Kiyosaki | 5,000 | 2025 |
Jordan Roy-Byrne | 4,000 | 2025 |
ANZ Bank | 3,600 | End-2025 |
Bank of America | 3,500 | 2025 |
Macquarie Group Ltd. | 3,500 | Q3 2025 |
Citi | 3,500 | 2025 |
Saxo Bank | 3,500 | 2025 |
Morgan Stanley | 3,400 | 2025 |
Deutsche Bank | 3,350 | EOY 2025 |
Goldman Sachs | 3,300 | EOY 2025 |
Société Générale (SocGen) | 3,300 | EOY 2025 |
UBS | 3,200 | 2025 |
IG Bank | 3,113 | H2 2025 (สูง) |
State Street Global Advisors | 3,100 | 2025 (High/Bull) |
J.P. Morgan | 3,000 | Q4 2025 |
Commonwealth Bank of Australia | 3,000 | Q4 2025 |
World Gold Council | 3,000 | 2025 (สูง) |
Capitalight Research | 3,000 | H2 2025 |
UOB | 3,000 | EOY 2025 |
Heraeus Precious Metals | 2,950 | 2025 |
London Bullion Market Assoc. | 2,917 | ตุลาคม 2025 |
Wells Fargo | 2,900 | 2025 (สูง) |
RBC Capital Markets | 2,823 | 2025 |
Canadian Imperial Bank (CIBC) | 2,800 | 2025 |
ING Bank | 2,800 | H2 2025 (สูง) |
TD Securities | 2,700 | Q2 2025 (สูง) |
Commerzbank | 2,650 | Q4 2025 |
World Bank Group | 2,325 | 2025 |
Analysts use many metrics to support their forecasts. เช่น, Morgan Stanley set a year-end target of $3,600 ต่อออนซ์. BlackRock holds an overweight position on gold, showing strong institutional confidence. Gold mining companies report record-high average prices and improved cost structures. Production has increased, and companies have secured new credit facilities to support operations.
Morgan Stanley targets $3,600 ต่อออนซ์, citing global tensions and central bank buying.
BlackRock maintains an overweight position on gold for H2 2025.
Gold-backed ETFs have added 329 tonnes year-to-date.
Chinese central bank has bought gold for 18 straight months.
Spot gold price stands near $3,298 per ounce in June 2025.
Experts expect prices to move toward $3,350–$3,400 as inflation moderates.
These points show that most analysts agree: gold will likely remain strong in the second half of 2025. The consensus reflects both market fundamentals and investor sentiment.
Recent Trends
2025 Highs
Gold hit new records in 2025. Spot prices went over $3,400 ต่อออนซ์. This was the highest price ever. The jump happened because central banks and investors wanted more gold. Gold prices went up almost 27% this year. This was better than most other investments. Central banks bought 244 tonnes of gold in the first quarter. That is 24% more than the five-year average. Gold-backed ETFs got over $21 พันล้าน in the first quarter. This was the biggest inflow since early 2022. These facts show gold is still a top safe-haven asset.
Statistical Record | ค่า |
|---|---|
All-time high spot price | Above $3,400 ต่อออนซ์ |
Year-to-date price increase | 27–31% |
Q1 2025 gold ETF inflows | Over $21 พันล้าน |
Central bank gold purchases Q1 2025 | 244 tonnes |
RSI (Relative Strength Index) | 75 (overbought conditions) |
📊 บันทึก: Gold’s technical momentum is still strong. ที่ RSI is at 75. This means gold is overbought, but investors are still interested.
Market Drivers
Many things help gold do well in 2025. Central banks in emerging markets moved up to 20% of their reserves into gold. This helps keep prices strong. It also shows a big change in global finance. Retail investors think gold will stay above $3,000 ต่อออนซ์. This has led to record ETF holdings.
The U.S. Dollar Index is 10–15% higher than its fair value. นิ่ง, gold prices have stayed strong. Real yields in the U.S. usually move the opposite way from gold prices. ใน 2025, gold stayed strong even when real yields went up. This shows investors are acting differently now. Global mine supply is steady. ดังนั้น, changes in demand for jewelry, เทคโนโลยี, and investment matter more for prices.
Central bank buying and ETF inflows push up demand.
Geopolitical risks and economic worries make gold more popular.
Federal Reserve policies and possible rate cuts make gold more attractive.
These reasons, along with strong demand, explain why gold prices are high and can change quickly as the second half of 2025 starts.
Key Factors
Macroeconomics
Macroeconomic trends can change gold prices in many ways. Things like inflation, interest rates, and commodity prices matter a lot. When inflation goes up, people like gold more as protection. If mining costs go up or less gold is made, prices can rise. เทคโนโลยีใหม่, such as AI and automation, helps mining companies save money and work faster. This can change how much gold is available and how prices move. The table below shows how these macroeconomic factors affect gold prices:
Macroeconomic Factor | Trend / หลักฐาน | Impact on Gold Prices |
|---|---|---|
Currency Exchange Rates | Weaker currencies boost local gold demand | |
Inflation | 1% inflation rise → 1.5% gold price increase | Gold acts as an inflation hedge |
Oil Prices | 10% oil price rise → 2–3% gold price increase | Higher oil costs raise inflation and gold prices |
Mining Costs | 5% cost rise → 1–2% gold price increase | Higher costs tighten supply, lift prices |
Tech Advancements | 15% mining efficiency gain, 20% labor cost cut | Improved supply, possible price moderation |
ESG Factors | 15% more sustainable mining, 5% less portfolio risk | Boosts gold’s appeal and demand |
Geopolitics
Geopolitical events can make gold prices go up. When there is political trouble, trade fights, or wars, people want safe places for their money. In early 2025, problems between the U.S. and China and other world issues made more people buy gold. The table below shows how recent world events changed gold prices:
Region | Timeframe | Influence on Gold Market |
|---|---|---|
อเมริกาเหนือ | Q1 2025 | U.S. gold prices hit $3,100/oz amid trade and political risks |
Asia-Pacific | Q1 2025 | China’s gold demand rebounded despite weak imports |
ละตินอเมริกา | Q1 2025 | Mexico’s gold prices rose due to instability and weak dollar |
ตะวันออกกลาง | Q4 2024 | Tensions and diversification away from oil supported prices |
🛡️ Gold becomes even more popular when the world feels unsafe, so prices can jump.
Central Banks
Central banks are very important in the gold market. They have been buying more gold for years, often over 1,000 tonnes each year. In the first part of 2025, central banks bought 244 tonnes, which is much more than usual. These big buys help keep gold prices high and show that banks trust gold.
Central banks in some countries buy gold to use less U.S. dollars and euros.
Lately, รัสเซีย, จีน, and India have bought a lot of gold, making prices go up.
บางครั้ง, central banks buy gold when prices are high and sell when prices drop, which can make prices change quickly.
Their choices about interest rates also change how much it costs to own gold.
Currency Impact
Changes in currency values can really affect gold prices. ใน 2025, พื้นที่ U.S. Dollar Index dropped by 9%. This was the biggest fall since 2009. Because of this, gold looked better to investors everywhere. Central banks bought more gold as the dollar got weaker. Gold ETFs got $21.1 billion in the first part of 2025, showing lots of people wanted gold.
Gold prices usually go up when the dollar goes down or real interest rates are negative.
Big banks think gold will stay between $3,000 และ $4,000 ต่อออนซ์, partly because of weaker currencies and less use of the dollar.
Gold often does well during recessions and hard times, showing it is a safe choice.
Gold Analyzer Insights

Technical Analysis
Gold analyzers use many tools to study price changes. Analysts look at real-time data and old patterns to understand the gold market. The table below lists some important tools and data sources for technical analysis in late 2025:
Market Tools and Data Sources | Details and Examples |
|---|---|
Algorithmic Trading Systems | Handle up to 80% of daily gold volume; use FPGAs for high-frequency trading |
Key Technical Levels | Support at $3,300; Resistance at $3,355–$3,375; 200-day moving average near $3,160 |
Technical Indicators | RSI signals overbought conditions |
Market Sentiment Indicators | COT net long positions (~247,000 contracts), high social media activity, fear/greed cycles |
ETF Flows and Institutional Positioning | SPDR Gold Trust (GLD) holds 910 tonnes; $21 billion inflows in Q1 2025 |
Fundamental Inputs | Central bank activities, inflation expectations, economic indicators |
Seasonal and Mining Data | Seasonal patterns and mining cost data |
Gold analyzer tools help traders find support and resistance. They also watch technical indicators like the RSI to see if gold is overbought. Market sentiment indicators, such as COT reports and ETF flows, show how investors feel about gold. These tools help analysts react fast to market changes.
Fundamental Analysis
Fundamental analysis looks at the big reasons behind gold price moves. Analysts check economic and financial factors that can change the market. They use gold analyzer tools to mix these factors with technical data for a full view. Key parts include:
Looking at company financial statements and economic indicators like interest rates and GDP growth.
Watching world events that might change gold demand.
Studying old data like price, volume, and volatility to spot trends.
Using metrics like historical volatility to measure past price swings.
Mixing technical tools, such as moving averages and trend lines, with fundamental data for better predictions.
Comparing economic data with old price moves to see what affects the market.
Studying old data helps traders know what is normal or strange in the market. By using both technical and fundamental analysis, gold analyzers give a clearer idea of what could happen next in the gold market.
Expert Forecasts
Price Targets
Big banks and analysts have raised their gold price guesses for late 2025. Many think gold will stay above $3,000 ต่อออนซ์. Some believe it could go much higher. ที่ table below lists different forecasts from top sources:
Institution/Analyst | Gold Price Target (USD) | Time Frame | Notes on Historical Comparison and Context |
|---|---|---|---|
Wells Fargo | ~$2,900 | 2025 | Targets raised after 2024 surge |
Citigroup | ~$3,000 | 2025 | Upward revision from earlier estimates |
Morgan Stanley | ~$3,400 | 2025 | Bullish after strong 2024 performance |
UBS | ~$3,500 | 2025 | Reflects recent price highs |
Deutsche Bank | ~$3,700 | 2026 | Ongoing bullish trend |
Goldman Sachs | ~$3,700 | 2025 | Macro risks drive aggressive target |
Bank of America | ~$4,000 | 2026 | Confidence in continued appreciation |
JP Morgan | $4,000 – $6,000 | 2026-2029 | Very bullish, citing central bank demand |
Peter Schiff | ~$5,000 | 2025 | Extremely bullish outlook |
Most predictions are between $2,800 และ $3,700 สำหรับ 2025. A few, like J.P. Morgan and Peter Schiff, think gold could reach $4,000 or even $5,000 ต่อออนซ์. These guesses come after gold did better than expected in 2024.
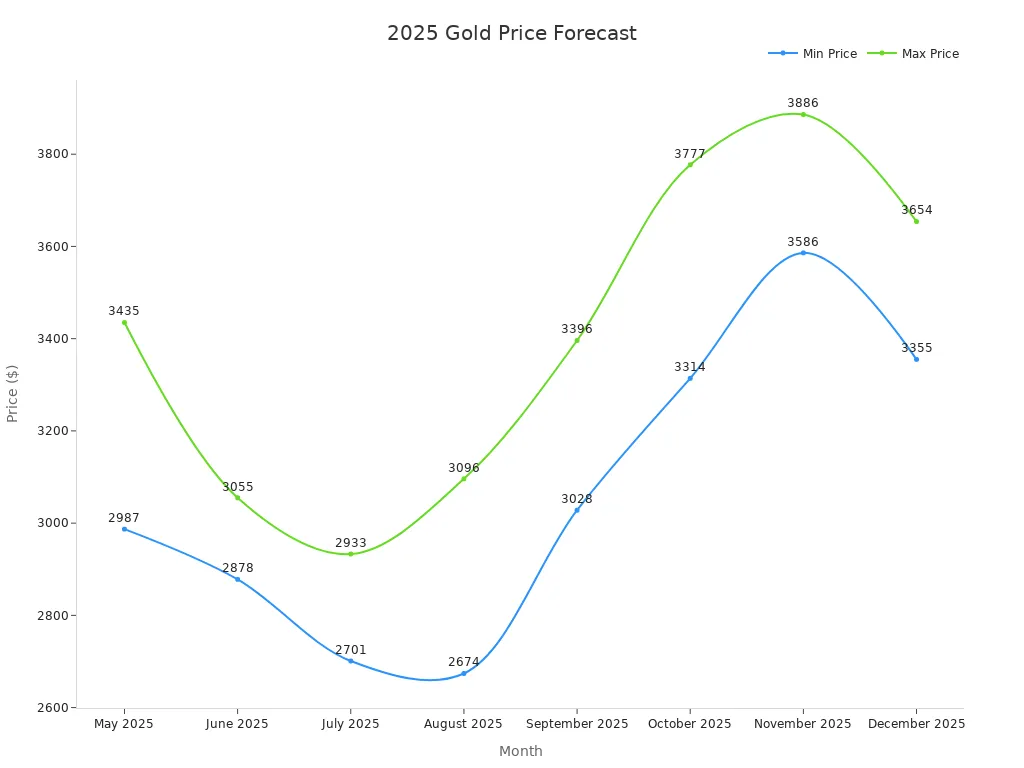
Monthly guesses for 2025 show gold staying above $3,000 most of the year. There might be peaks near $3,886 in November and $3,654 in December. Technical models find support close to $2,961 and resistance around $3,503. This means gold could stay strong even if the market drops.
Market Sentiment
Experts agree gold is still a top safe-haven asset in 2025. Central banks keep buying gold at record levels. They have bought over 1,000 tonnes each year for three years. A new survey says 95% of central banks want to buy more gold next year.
Investors also feel good about gold. ที่ put/call ratio for SPDR Gold Trust (GLD) is 0.67. This shows people are more hopeful than worried. Technical indicators like the 50-day and 20-day moving averages show a strong upward trend. Trading volumes go up when things feel uncertain. The Fear and Greed Index shows more people want gold as a safe choice.
📈 Most experts think gold will stay strong. Central bank buying, investor demand, and world risks help keep prices high. This agreement pushes forecasts to higher price targets for the rest of 2025.
Investor Guidance
Using Gold Analyzer
ใน 2025, investors use smart tools to help them decide. A gold analyzer lets people watch price changes and market moves. These tools use live data and AI to find patterns and warn users about changes. Investors can see how gold acts when inflation rises or when central banks make choices. They also see how world events affect gold. The table below lists important facts that help people pick what to do:
Evidence Category | Key Statistical Evidence |
|---|---|
Historical Gold Price Gains | Three major bull markets with gains of 2,328% (1971-1980), 653% (2001-2011), และ 179% (2018-2025 ongoing) |
Volatility | Short-term volatility can exceed 20% ทุกปี |
Correlations | Positive correlation with inflation (+0.7 ถึง +0.8) when inflation >3-4%; negative correlation with equities (-0.3 ถึง -0.6) during crashes |
Recession Performance | Positive returns in 85% of recessions, averaging 15-25% gains |
Central Bank Demand | 244 tonnes purchased in Q1 2025, 24% above five-year quarterly average |
ETF Inflows | $21.1 billion inflows in Q1 2025, largest since Q1 2022; total holdings 3,445 tonnes, AUM $379 พันล้าน |
Gold analyzer tools also help track how ETFs are doing. เช่น, one big gold ETF went up 60.4% in early 2025. It had $2.9 billion in assets and a 0.5% expense ratio. These facts help investors compare choices and pick the best plan.
Risk Management
It is important to manage risk in the gold market. Gold prices can change fast, so investors need a plan. Here are some steps to help lower risk and get better results:
ใช้ AI bots that watch gold price swings and news.
Check technical indicators like moving averages and Bollinger Bands for buy and sell signals.
Test your ideas with old gold data, especially when prices moved a lot.
Set clear loss limits, like a 15% max loss and stop-loss orders.
Keep each trade small, เท่านั้น 0.5% ถึง 1% of your total money.
💡 เคล็ดลับ: Watch gold metrics like the VIX, DXY, and 10-year Treasury yields. These numbers help you change your plan when the market changes.
A good risk plan helps investors stay calm when prices jump. By using gold analyzer tools and these steps, investors can protect their money and find new chances.
Gold prices are still very high in the second half of 2025. Analysts think prices will stay strong, but they might change quickly. Central banks are buying more gold. ETF inflows are also high. The US dollar is weaker now.
Gold hit $3,396 ต่อออนซ์ in the first quarter. This is almost 30% higher than in January.
ETFs got over $21 พันล้าน, and central banks bought 244 tonnes in the first quarter.
Investors can use a gold analyzer and market tools to help them. These tools show trends, help manage risk, and find good chances to buy or sell.
Investors should look out for quick market changes, world problems, and interest rate moves.
คำถามที่พบบ่อย
What is a gold analyzer?
A gold analyzer is a special tool or computer program. It helps people look at gold prices. The tool uses live data, charts, and technical signs. People use it to find patterns and lower risk. It also helps them make smarter choices when buying or selling gold.
Why do central banks buy so much gold?
Central banks buy gold to keep their money safe. Gold helps them worry less about other currencies. It is a safe thing to own when the world has problems.
How do global events affect gold prices?
Big world events can make gold prices go up. Wars, elections, or trade fights can cause this. People think gold is safe when things feel risky.
Can gold prices fall quickly in 2025?
Experts think gold prices will stay high in 2025. Fast drops are not likely because many people want gold. Central banks and investors help keep prices strong. But prices could still change fast if something big happens in the world.


วอทส์แอพพ์
สแกน QR Code เพื่อเริ่มแชท WhatsApp กับเรา.